CAGR Insights is a weekly newsletter full of insights from around the world of the web.
What we’re reading this week
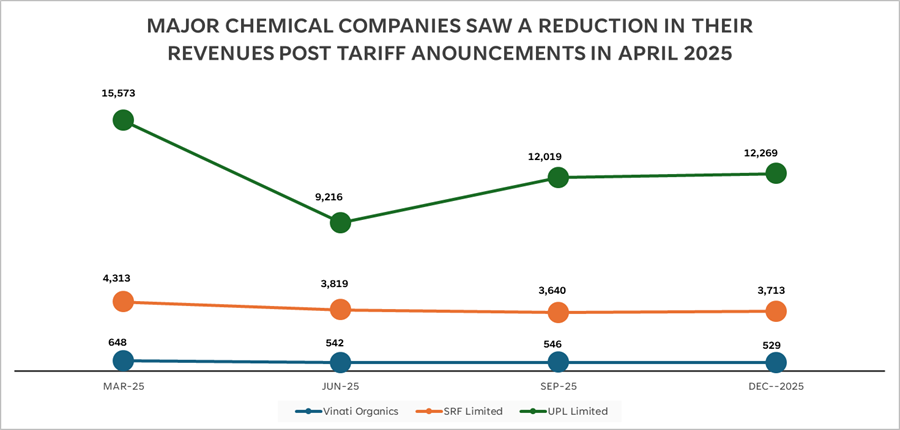
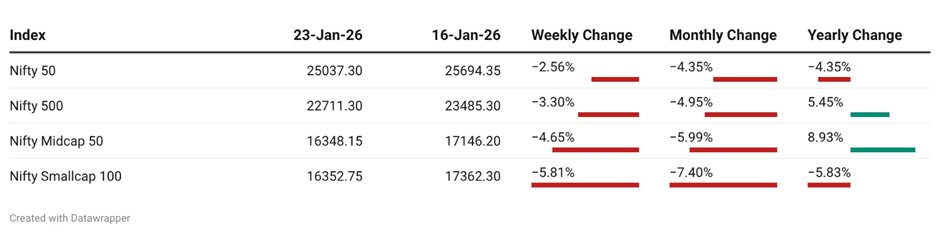
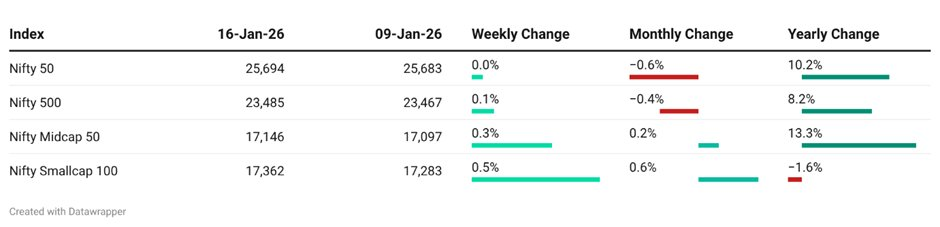
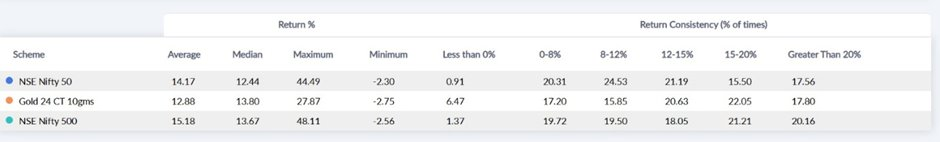
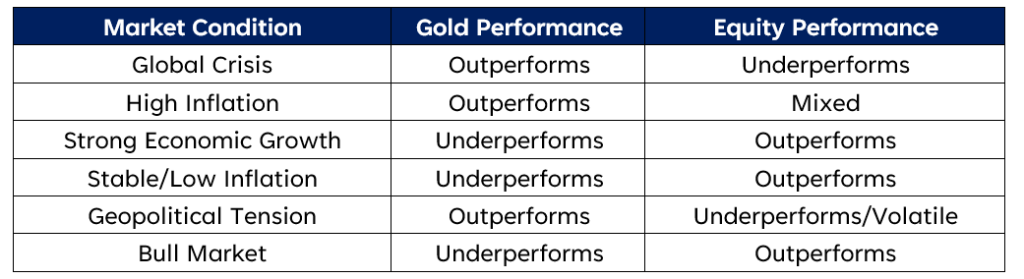
2026 markets may reward allocation shifts, not past winners: Read here
Sebi unveils life-cycle mutual funds; solution-oriented schemes scrapped — what it means for your portfolio: Read here
With new data sources and process upgrades, new GDP data set to capture the economy more accurately: Read here
Safe Hai, Smart Hai Kya? Check Your Insurance Returns!
LIC is known for its promise of “Zindagi ke saath bhi, zindagi ke baad bhi”. It is not just a legacy organization but also an example of what “trust” looks like in Indian financial markets.
“Har Ghar LIC” is a truth we come across almost every day. So, we delved a little deeper into how that happened.
Ramesh (36) is sitting on his balcony, looking at his kids playing. His friend, Prakash a financial advisor, drops by. Ramesh is worried about the rising costs of education and the “what ifs” of life. Prakash senses his tension and opens the conversation.
Prakash: “Ramesh, ek baat batao—have you ever thought about a plan that builds a massive fund for your kids’ future, but also acts as a security shield that costs you practically nothing?”
Ramesh: “Sounds like a dream, bhai. But seriously, what is this policy about?”
Prakash: “Bhai, it’s a brilliant ‘Two-in-One’ product. It’s designed so you can save for your big goals while making sure your family is 100% taken care of, no matter what happens.”
Ramesh: “Okay, but asliyat mein how does it work? Calculation kya hai?”
Prakash: “Let me explain. You’re 36 right now. In this plan, you just need to set aside Rs. 51,000 every year for the next 21 years. That’s just about Rs. 4,200 a month—ek choti si bachat. Over the full term, you pay a total of Rs. 10.7 lakhs.
Now, look at how the magic happens in two scenarios:
- Scenario 1: You reach the 21-year mark, the policy matures, and you’re standing there ready to enjoy your retirement or kids’ weddings. You get a Guaranteed Sum of Rs. 11 lakhs, plus additional bonuses. These bonuses can be as much as Rs. 10–11 lakhs extra! So, on maturity, you’re looking at more than double the amount you paid.
- Scenario 2: If something unfortunate happens to you, we don’t wait for 21 years. Your family immediately gets the full Rs. 11 lakhs to ensure their life keeps moving smoothly.
So, Ramesh, simple logic hai: Aap rahe toh bhi paisa, aur aap na rahe, toh family ko paisa. Honestly, you’re building wealth and getting your Life Insurance practically free!
That is indeed a tempting conversation. And a few of our clients had these policies when they came to us. Most of these policies were bought between 1995-2005 when FD interest rates were around 8-10%.
By the way, the return that our clients made on this policy was around ~6.5%.
Tax Free? Yes
Guaranteed? Almost
Beating inflation? Not really
Most families buy guaranteed savings plan because they are safe, offer guaranteed returns and are a default source of funding for long term goals.
When we were growing up in early 1990s, our parents had limited investing options. They bought a house to live in (and later pass on as legacy asset), bought gold as jewellery (primarily to use in childrens’ wedding), parked most of the liquid money in FDs. Both real estate and gold were tangible assets and came with a resistance to sell. FD was liquid which also meant it was the default source of funding emergencies and all short-term goals. LIC stepped in as a wonderful way to save for goals which were 10-20 years away. Buying LIC policies were akin to “planning for the future”. It is understandable why families had multiple LIC policies then.
What is confusing is why people in their 30s today continue to hold LIC and the likes of it.
Let us elaborate on why we are not big fans of the insurance cum investment product universe. For the purpose of today’s letter, we will focus on guaranteed savings plan. Stay tuned for our deep dive on market linked ULIP Plans in March.
The XIRR Reality Check –
In many traditional endowment conversations, agents focus on the absolute maturity amount.
The Rule of 72 helps you reverse-engineer the “wow factor”:
Eg: An agent says your money will double in 20 years. 72 / 20 = 3.6% (This is lower than most savings accounts).
It is shockingly low, isn’t it? That is the “Absolute Number Trap.”
When an agent says, “You pay ₹1 Lakh for 20 years and get ₹40 Lakh back,” it sounds like a fortune. But once you factor in the time it took to get there, you realize the growth wasn’t working hard—it was barely breathing.
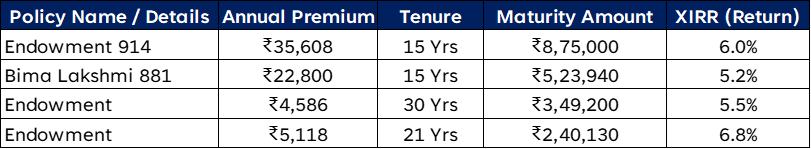
To put this into perspective we have analyzed 2 LIC policies which our clients had from early 2000’s and 2 new policies which are currently being sold. The analysis reveals a stark financial reality: none of them deliver returns that beat inflation.
If your investment grows at 5.5% while the cost of a college degree grows at 10%, you aren’t creating wealth; you are losing purchasing power.
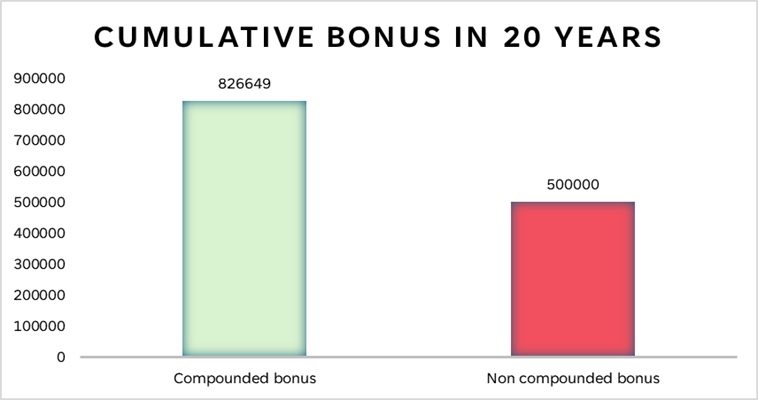
The “Simple” vs. “Compound” Trap
One of the “opaquest” parts of traditional insurance is the way returns are calculated. Most LIC policies use a Simple Reversionary Bonus.
High Upfront Leakage (Commissions)
When you pay your first LIC premium, a significant portion—often 25% to 35%—goes straight to the agent as commission. Subsequent years see a 5% drain.
Just for context, Mutual Funds have an Expense Ratio of just 0.4% to 2%.
This explains the push nature of LIC salespersons to sell LICs to families. The revenue is too lucrative. And this is not just for LICs – this is true for all insurance cum investment products.
Under-Insurance: The Silent Risk
These insurance and guaranteed savings plan bundle insurance and investment. This usually results in:
Low Life Cover: A ₹1 Lakh annual premium might only give you a ₹10 Lakh cover. If the breadwinner passes away, ₹10 Lakhs is rarely enough to sustain a family for more than a year or two.
Exit Trap – One major drawback of traditional LIC policies is limited liquidity. Once you invest, it’s difficult to exit without incurring significant losses.
For comparison:
- A Fixed Deposit (FD) can be broken early, usually with a small penalty of around 1%.
- Most Mutual Funds (MFs) allow you to redeem after 1 year with no exit load.
When you lock in your money and give up easy access, your investment should ideally offer a higher return as a premium for this illiquidity.
Illiquid:
LIC sells most of its traditional policies as long-term commitments — 15, 20, even 25 years. The pitch is simple: stay invested for the long term and you’ll benefit.
And that logic is fair — every genuine long-term instrument rewards you for staying invested:
- Equity rewards patience with growth and compounding.
- PPF rewards lock-in with tax-free compounding.
- Fixed deposits reward tenure with higher interest for longer terms.
Wealth creation requires the ability to pivot.
- LIC: Policies are rigid. If you stop paying premiums in the first few years, you risk losing your principal. Surrendering a policy often results in a massive “haircut” on your savings.
- Equity: Equity investments or mutual fund SIPs allow you to pause, stop, or withdraw your contributions at any time (subject to minor exit loads or taxes), giving you the freedom to manage life’s emergencies without jeopardizing your hard-earned capital.
The most effective way to build wealth is to stop treating insurance as an investment and start treating it as a utility.
Conclusion:
Insurance cum investment savings plan were relevant when alternatives were limited. Today, they happen to be a sub-optimal investing choice. They sell safety but the real risk is not beating inflation. The real risk is not having enough when we need different milestones of our life. And these products do very little to cater to that.
We therefore always recommend having a Term Plan to protect the risk of loss of life (and thus earning capacity) and having an investment plan which has got nothing to do with insurance.
In case you have policies which you want us to look at, feel free to reach out to us on https://www.cagrfunds.com/contact
****
That’s it from our side. Have a great weekend ahead!
If you have any feedback that you would like to share, simply reply to this email.
The content of this newsletter is not an offer to sell or the solicitation of an offer to buy any security in any jurisdiction. The content is distributed for informational purposes only and should not be construed as investment advice or a recommendation to sell or buy any security or other investment or undertake any investment strategy. There are no warranties, expressed or implied, as to the accuracy, completeness, or results obtained from any information outlined in this newsletter unless mentioned explicitly. The writer may have positions in and may, from time to time, make purchases or sales of the securities or other investments discussed or evaluated in this newsletter.